Editor's Note: Today we're featuring a guest post from VDraw, an innovative AI-powered visual content creation platform. Among their various visualization tools, their most impressive offering is the AI YouTube Summary Generator, which automatically transforms video content into engaging infographics and visual summaries. As many of our readers are content creators and marketers who frequently work with visual content, we believe their insights will be valuable to our community.
In this post, VDraw shares insights on creating effective infographics and visual content that resonates with your audience. The post includes practical strategies for visual storytelling, real-world applications, and tips for leveraging AI in your creative process.
A massive thank-you to VDraw's founding team for their vision and dedication. As they often say, "Too many brilliant ideas get lost due to unclear presentation." This belief drives their mission to empower everyone with AI-enhanced visualization tools, making complex ideas simple and engaging. Their innovative approach spans across social media marketing, brand design, business reporting, data analysis, and educational content creation.
For more from VDraw, check out their main website,VDraw, and experience their flagship AI YouTube Summary Generator , which automatically transforms video content into engaging infographics, or follow them on X for the latest updates on AI-powered visual content creation.
"Hey Sarah, how did you manage to get so many shares on your latest social media post?" Tom leaned over his desk, coffee in hand, curiosity evident in his voice.
Sarah smiled, pulling up her screen to show a beautifully designed infographic that had gone viral. "The secret? I've been using VDraw to transform my YouTube content into engaging infographics. It's completely changed my social media strategy."
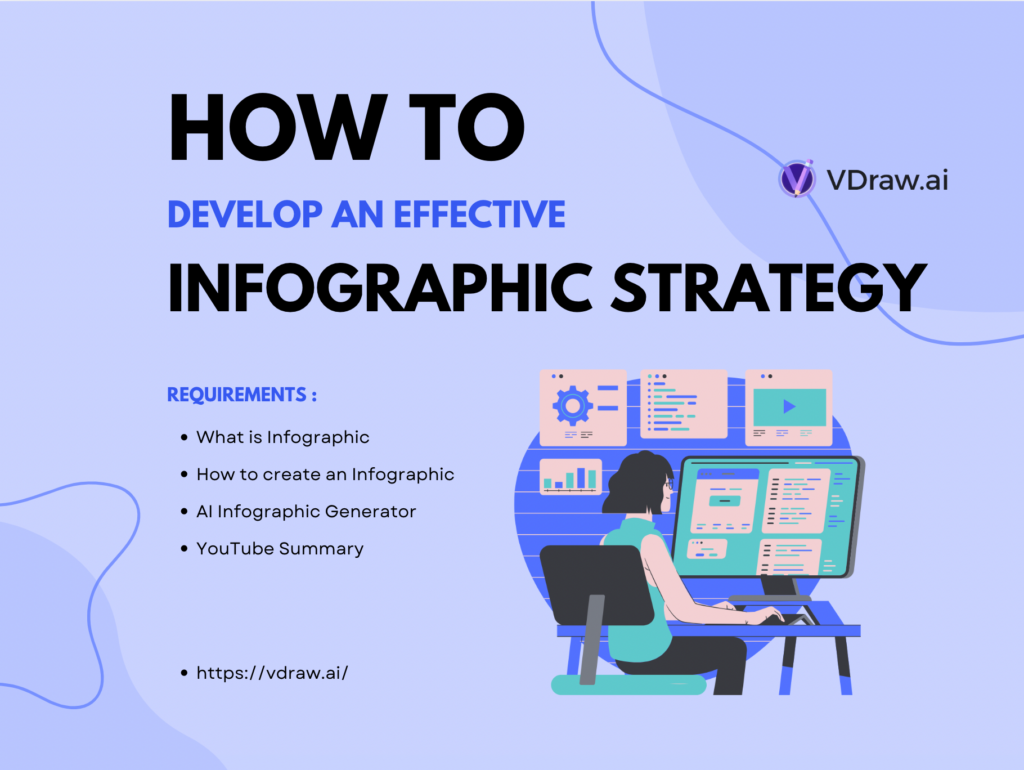
This conversation is happening more frequently in marketing departments worldwide, and for good reason. In today's fast-paced digital landscape, creating an effective infographic strategy isn't just an option – it's a necessity for standing out in the crowded social media space.
The Evolution of Visual Content Strategy
Remember when simple text posts were enough to capture attention? Those days are long gone. Today's social media landscape demands more sophisticated infographic strategy implementation. Studies show that content with relevant images gets 94% more views than content without visual elements. This shift has transformed how we approach content creation and social media management.
Why Infographics Matter More Than Ever
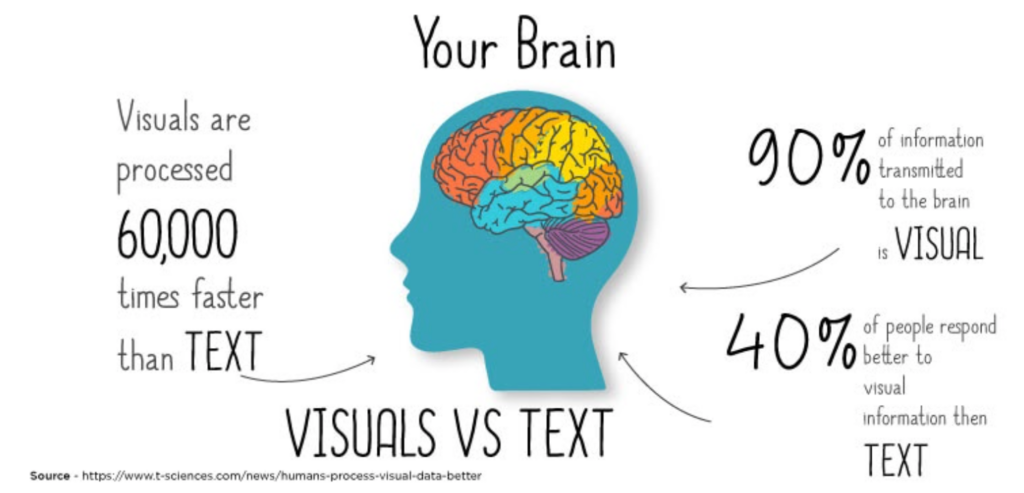
The human brain processes images 60,000 times faster than text. This isn't just a fascinating fact – it's the foundation of modern infographic strategy development. In our scrolling culture, where attention spans are shorter than ever, your infographic content strategy can make the difference between engagement and invisibility.
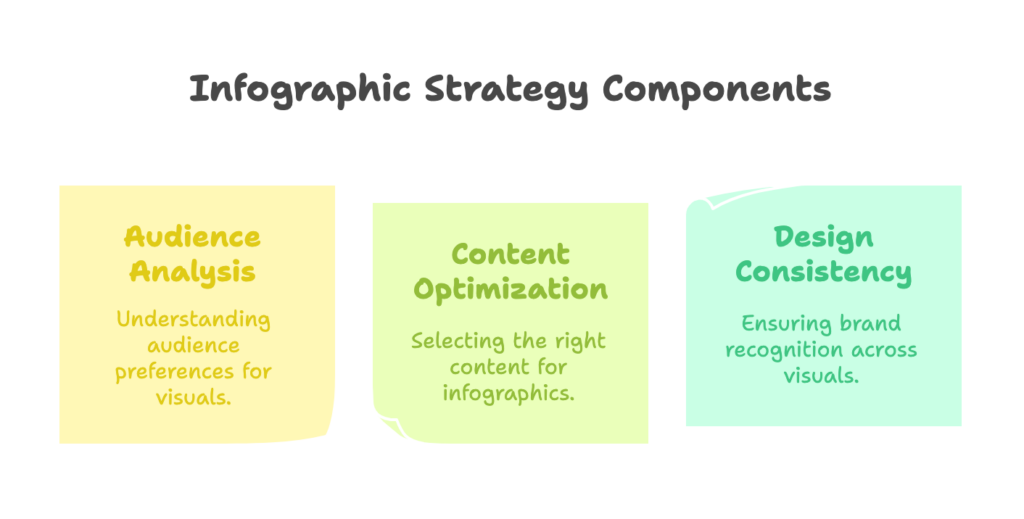
Building Blocks of a Successful Infographic Strategy
1. Understanding Your Audience's Visual Preferences
Before diving into infographic creation, it's crucial to understand what resonates with your audience. Different industries and demographics respond to different visual styles. Your infographic strategy framework should begin with thorough audience analysis.
2. Content Selection and Optimization
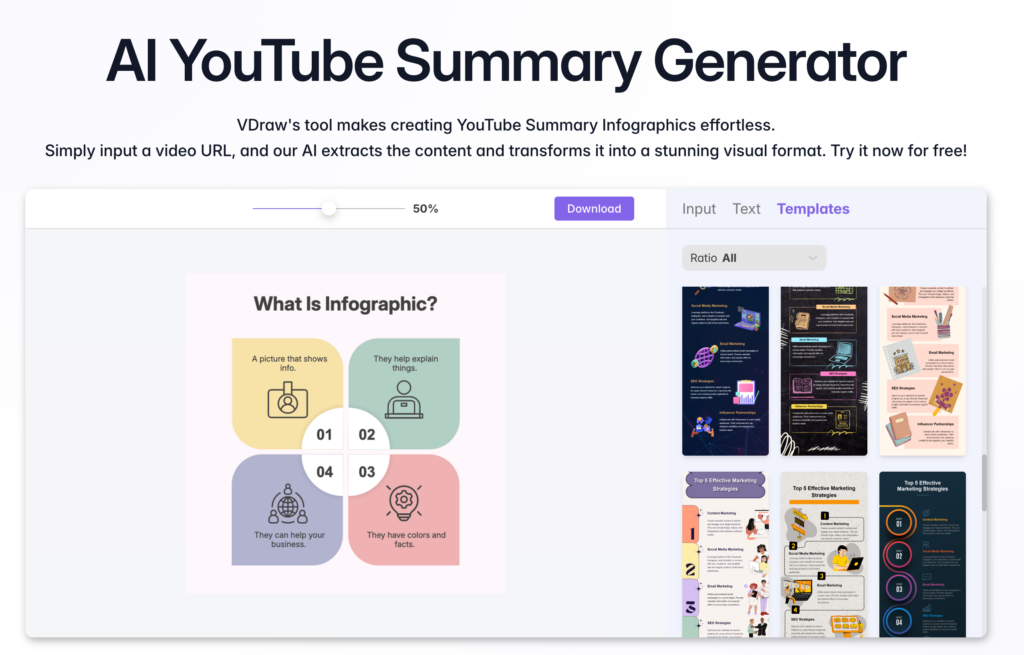
Not every piece of content needs to become an infographic. Part of developing a smart infographic strategy plan involves knowing which messages benefit most from visual representation. This is where tools like VDraw's AI YouTube Summary Generator become invaluable – they help you identify and transform your most impactful content.
3. Design Consistency in Your Infographic Strategy
Brand consistency is crucial when implementing your infographic strategy guidelines. Your visual content should be immediately recognizable as yours, whether it's shared on LinkedIn, Twitter, or Instagram.
Advanced Techniques in Infographic Strategy Development
Data Visualization Mastery
The core of any effective infographic strategy implementation lies in how well you present data. Complex information needs to be simplified without losing its impact. This is where many content creators struggle, but technological solutions are making this process more accessible.
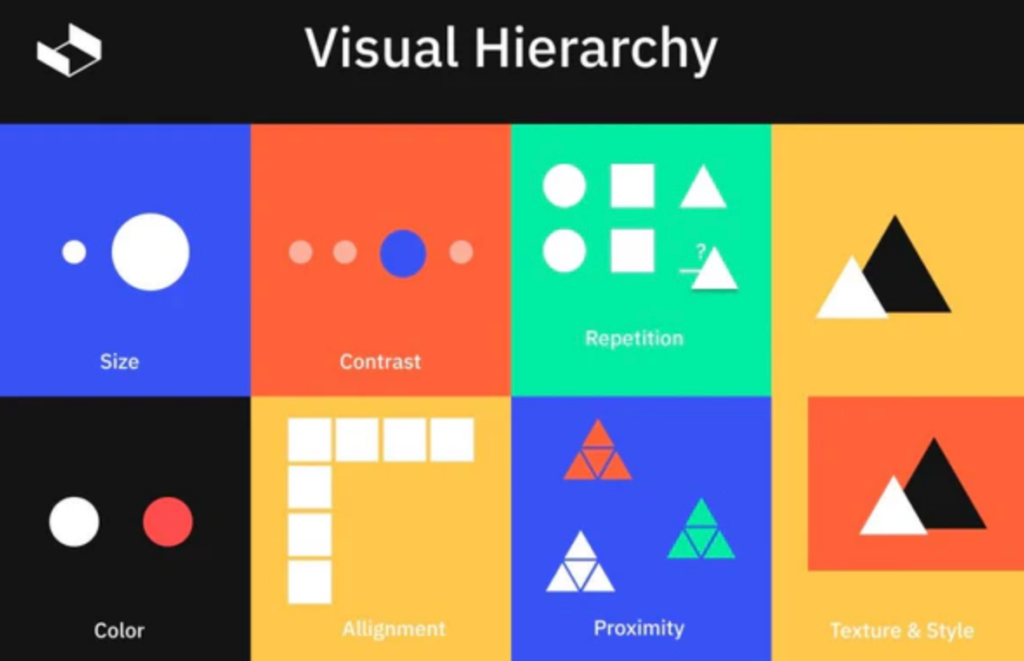
1. Data Hierarchy Organization
Creating a clear visual hierarchy is essential for effective data presentation. This involves:
- Establishing primary and secondary data points
- Using size and position to indicate importance
- Creating visual flow through strategic placement
- Implementing consistent color coding systems
2. Chart Selection Principles
Choose the right visualization format for your data:
- Bar charts for comparisons
- Line graphs for trends over time
- Pie charts for showing composition (limited to 6-7 segments)
- Scatter plots for showing relationships
- Heat maps for complex data sets
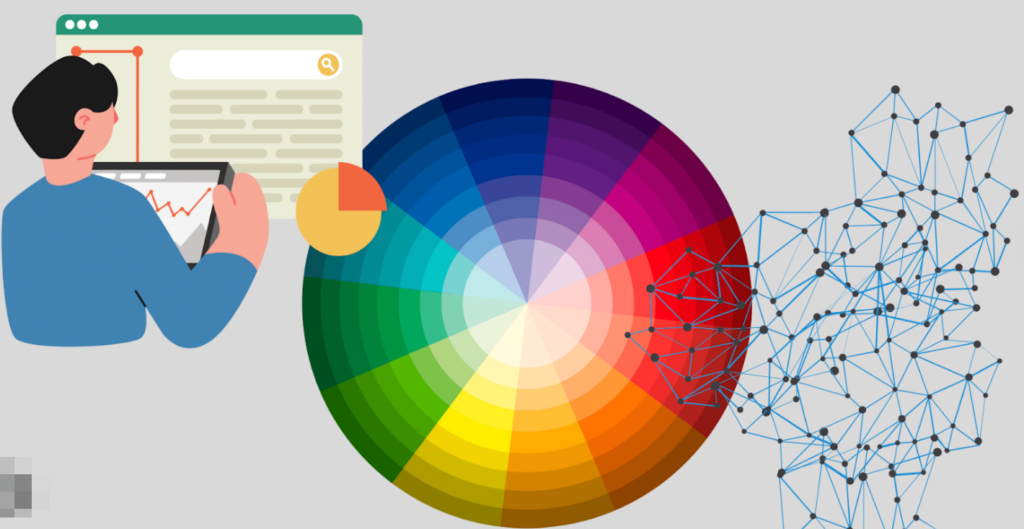
3. Color Psychology in Data Visualization
- Use contrasting colors for important comparisons
- Implement color gradients to show progression
- Maintain brand consistency while ensuring readability
- Consider colorblind-friendly palettes
Storytelling Through Visual Elements
Your infographic content strategy should prioritize narrative flow. Even the most data-heavy infographics need to tell a story. This approach helps in:
- Maintaining viewer attention
- Improving information retention
- Encouraging social shares
- Building brand recognition
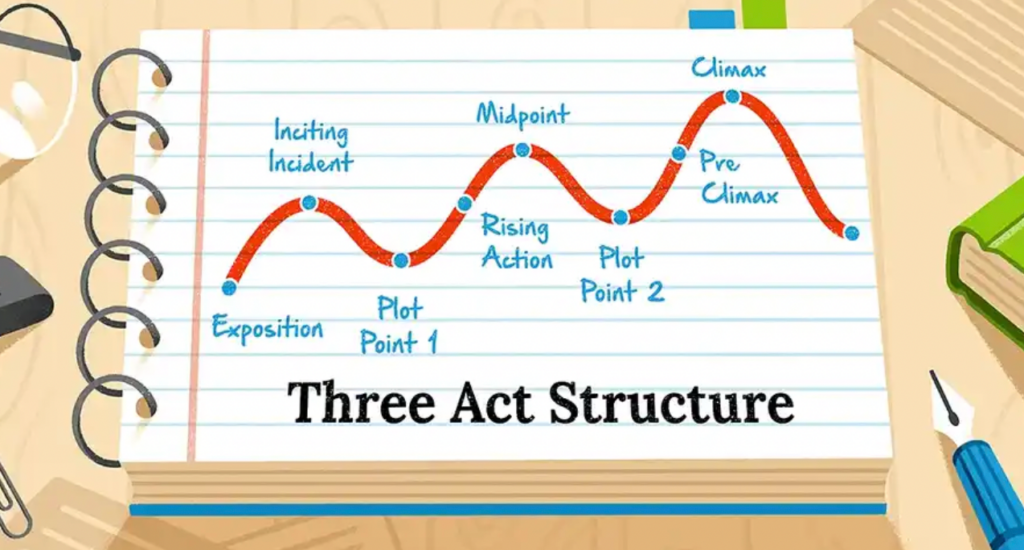
1. Creating a Visual Narrative Arc
- Opening hook: Start with an attention-grabbing statistic or visual
- Rising action: Build context through supporting data
- Climax: Present your key findings or main message
- Resolution: Conclude with actionable insights or next steps
2. Visual Hierarchy Techniques
- Size variation to emphasize importance
- Strategic use of white space
- Directional cues to guide the eye
- Consistent typography hierarchy
3. Emotional Design Elements
- Use of relatable imagery
- Implementation of appropriate icons
- Integration of human elements
- Careful selection of color schemes that evoke desired emotions

Leveraging Technology for Infographic Strategy Success
The digital age has brought us powerful tools that streamline the infographic creation process. One standout solution is VDraw's AI YouTube Summary Generator, which represents a significant leap forward in infographic strategy automation.
Advanced Features of Modern Infographic Tools
-
Automated Data Processing
- Real-time data integration
- Automatic formatting adjustments
- Smart template suggestions
- Dynamic content scaling
-
AI-Powered Design Assistance
- Color palette recommendations
- Layout optimization
- Typography pairing
- Element spacing suggestions
-
Cross-Platform Optimization
- Responsive design capabilities
- Multi-format export options
- Social media size presets
- Mobile-first considerations
The Role of AI in Modern Infographic Strategy
Artificial intelligence is revolutionizing how we approach infographic strategy development. Tools that can automatically transform video content into compelling infographics are changing the game for social media managers and content creators.
AI-Driven Innovation in Infographic Creation
-
Content Analysis
- Natural language processing for key point extraction
- Sentiment analysis for tone matching
- Automatic content categorization
- Priority scoring for information hierarchy
-
Design Intelligence
- Smart layout suggestions based on content type
- Automated visual hierarchy implementation
- Dynamic color scheme adaptation
- Intelligent space utilization
-
Performance Optimization
- A/B testing capabilities
- Engagement prediction models
- Automated performance reports
- Real-time optimization suggestions
Common Pitfalls in Infographic Strategy Implementation
Information Overload
One of the biggest mistakes in infographic strategy development is trying to include too much information. Remember, the goal is clarity and impact, not comprehensiveness.
How to Avoid Information Overload
-
Focus on Core Message
- Identify 2-3 key takeaways
- Remove redundant information
- Use progressive disclosure for complex topics
- Break complex infographics into series
-
Data Prioritization
- Use the 80/20 rule: focus on the most impactful 20% of your data
- Create clear information hierarchy
- Eliminate unnecessary decorative elements
- Use white space effectively
-
Content Optimization Techniques
- Implement chunking strategy
- Use bullet points for quick scanning
- Create visual anchors
- Maintain consistent visual rhythm
Signs of Information Overload
- Text-heavy designs
- Cluttered layouts
- Competing visual elements
- Unclear narrative flow
- Multiple competing focal points
Poor Mobile Optimization
Your infographic content strategy must account for mobile viewers. With over 60% of social media consumption happening on mobile devices, this isn't optional.
Essential Mobile Optimization Strategies
-
Design Considerations
- Implement responsive scaling
- Use mobile-first design principles
- Optimize text size for small screens
- Ensure touch-friendly element spacing
-
Content Structure
- Vertical scrolling optimization
- Progressive content loading
- Collapsible sections for long content
- Clear visual hierarchy
-
Technical Optimization
- Optimize file sizes
- Use appropriate image compression
- Implement lazy loading
- Consider bandwidth limitations

Mobile-Specific Best Practices
-
Layout Optimization
- Single-column designs
- Minimal horizontal scrolling
- Clear call-to-action placement
- Touch-friendly interactive elements
-
Typography Guidelines
- Minimum 16px font size
- High contrast text
- Limited font variations
- Clear heading hierarchy
-
Visual Elements
- Simplified charts and graphs
- Clear tap targets (minimum 44x44 pixels)
- Optimized image resolution
- Reduced animation usage
The Future of Infographic Strategy
As we look ahead, several trends are shaping the future of infographic strategy:
- Interactive elements
- Animated components
- AI-driven personalization
- Real-time data visualization
Transforming Your Content with VDraw
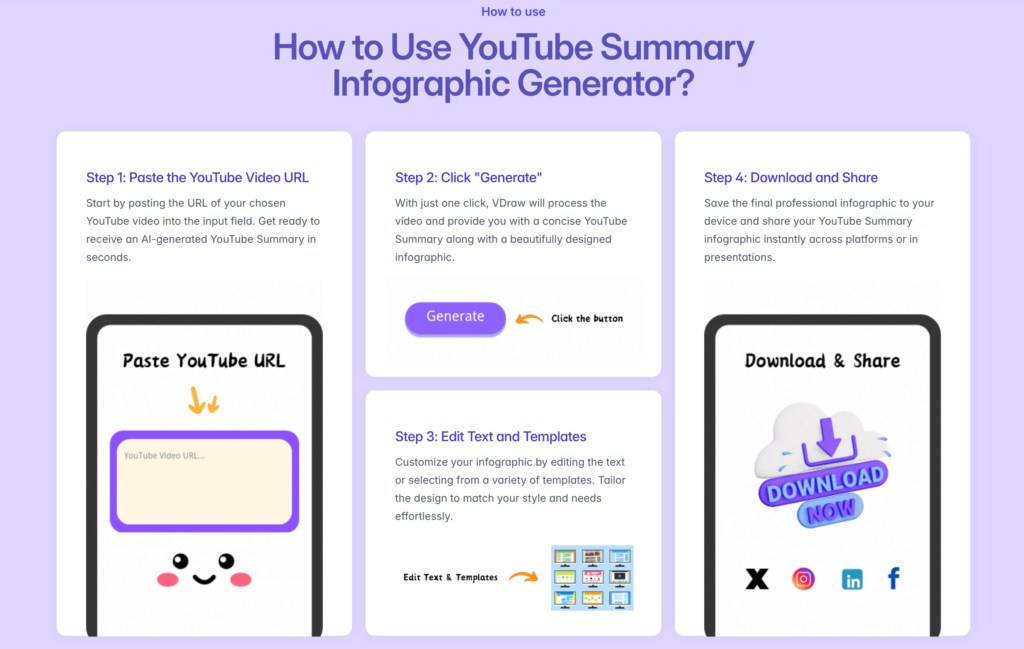
This is where VDraw's AI YouTube Summary Generator comes into play as a very useful tool for your infographic strategy implementation. This innovative solution allows you to:
- Simply input any YouTube URL
- Automatically generate professional infographics
- Choose from various templates to match your brand
- Fine-tune text and visual elements
- Download high-quality PNG files ready for sharing
Why VDraw Stands Out
What makes VDraw's solution unique in the realm of infographic strategy tools is its ability to seamlessly transform video content into shareable infographics. This automated process saves hours of manual work while ensuring consistent quality in your visual content strategy.
Conclusion: Your Next Steps in Infographic Strategy
As we've explored throughout this guide, developing an effective infographic strategy is crucial for modern social media success. With tools like VDraw's AI YouTube Summary Generator, creating compelling visual content has never been more accessible.
Ready to revolutionize your social media presence with powerful infographics? Visit VDraw today and discover how our AI YouTube Summary Generator can transform your content strategy. Turn your YouTube videos into engaging infographics with just a few clicks, and watch your social media engagement soar.
Remember, in the world of social media, a strong infographic strategy isn't just about creating pretty pictures – it's about telling your story in the most engaging way possible. With VDraw, you're not just creating infographics; you're crafting visual experiences that resonate with your audience and drive real results.